wxs.us
The worst Day 1 outlook ever issued for every location.
Each map folds every Day 1 convective outlook the Storm Prediction Center has ever issued into a single picture: a location's color is the most severe value it has ever been given, no matter the year. The maps update daily as new outlooks are issued.
Categorical history begins in 1987. Tornado, wind, and hail probabilities begin in 2002, when SPC started issuing them. The 25% and 35% tiers appear only in early probabilistic outlooks and were later retired; today's ladder steps from 30% to 45%.
Categorical severe threat
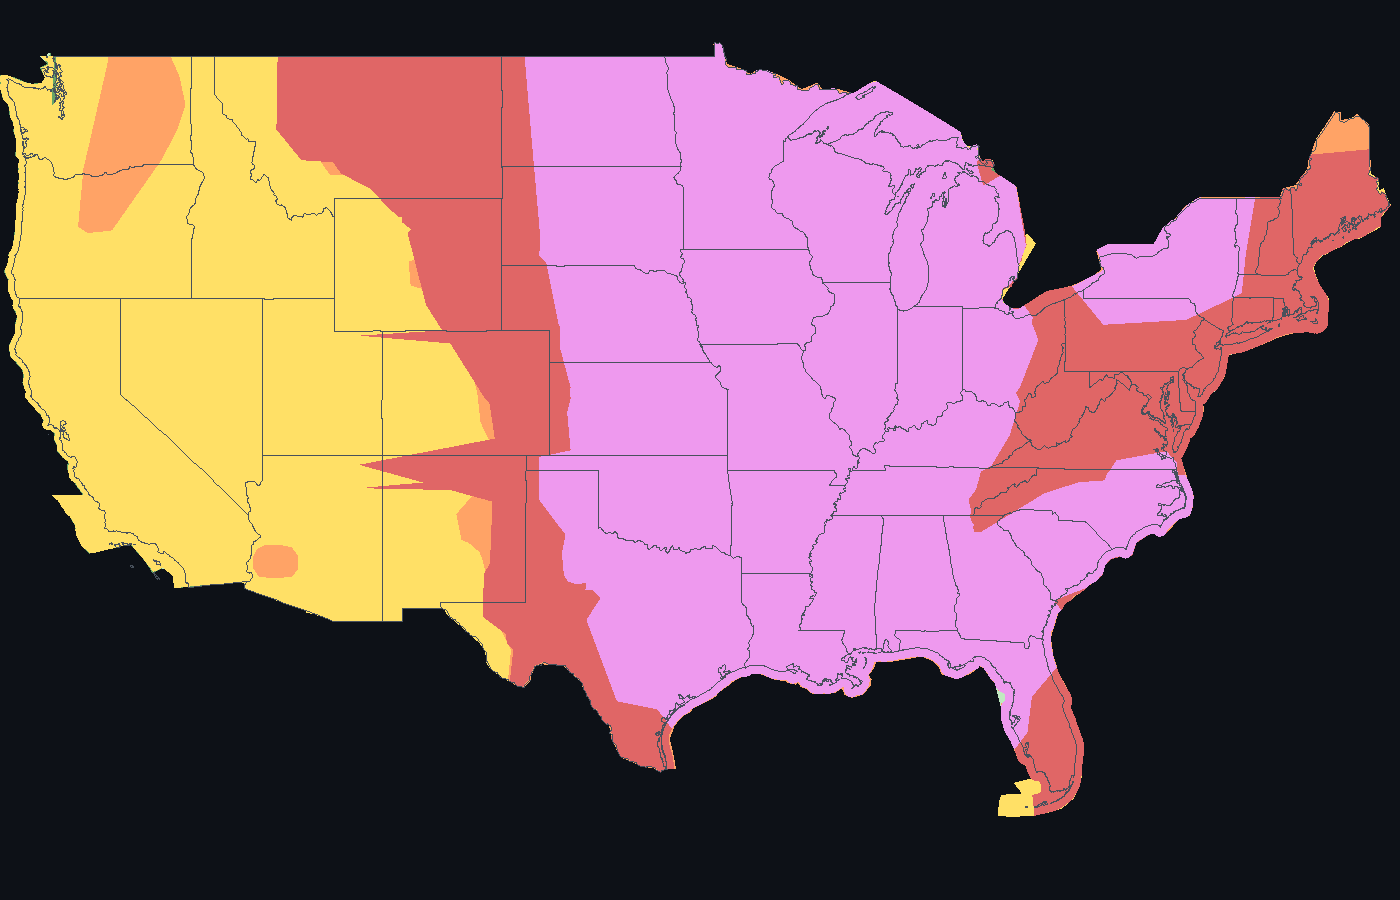
Highest categorical risk level ever assigned, 1987 to today. Marginal and Enhanced exist only since October 2014, so they show mostly near the edges of historic risk areas.
Tornado probability
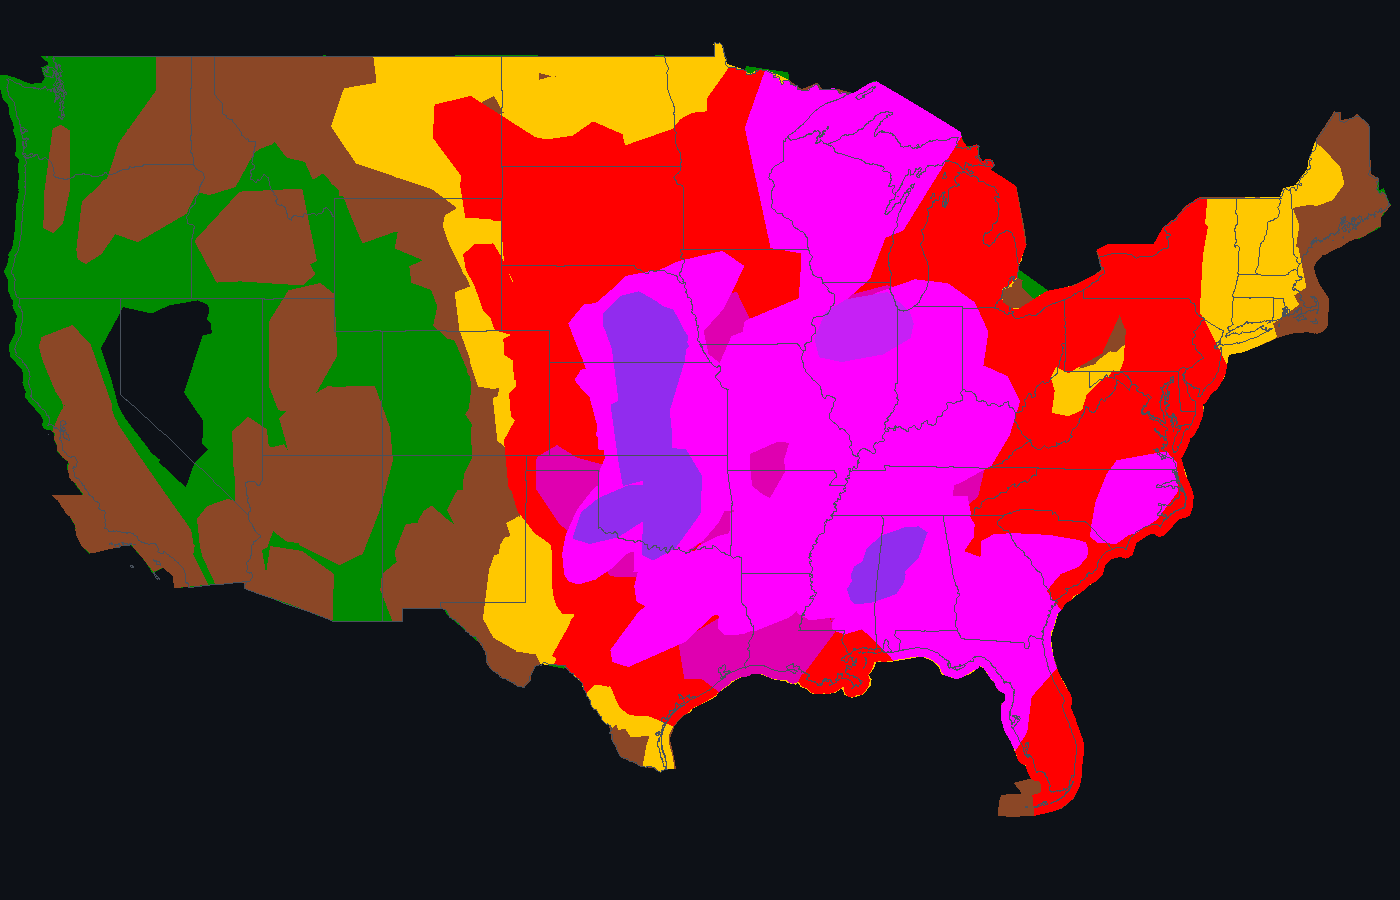
Highest tornado probability ever assigned, 2002 to today.
Wind probability
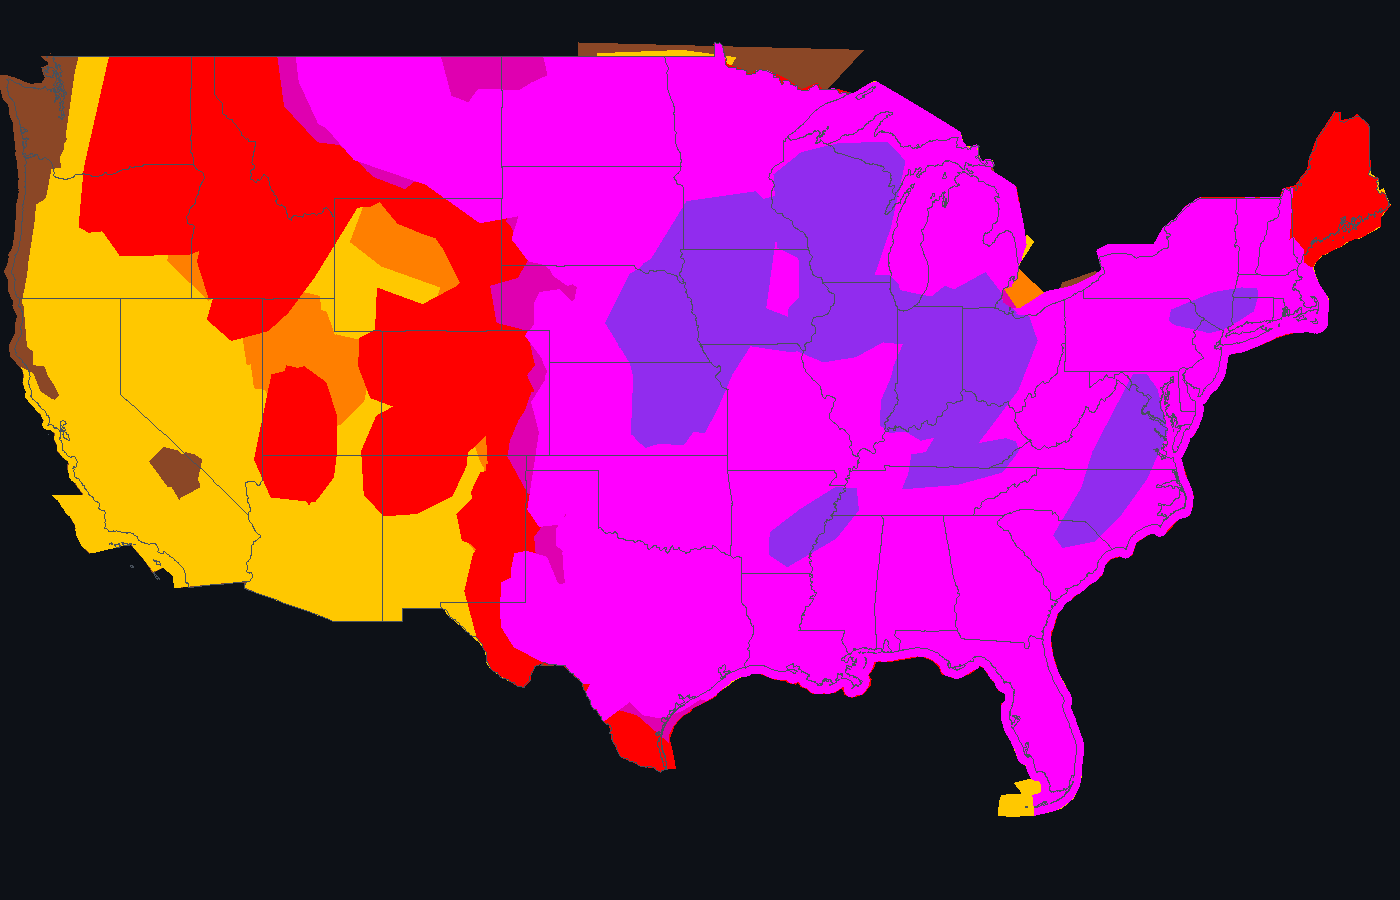
Highest damaging wind probability ever assigned, 2002 to today.
Hail probability
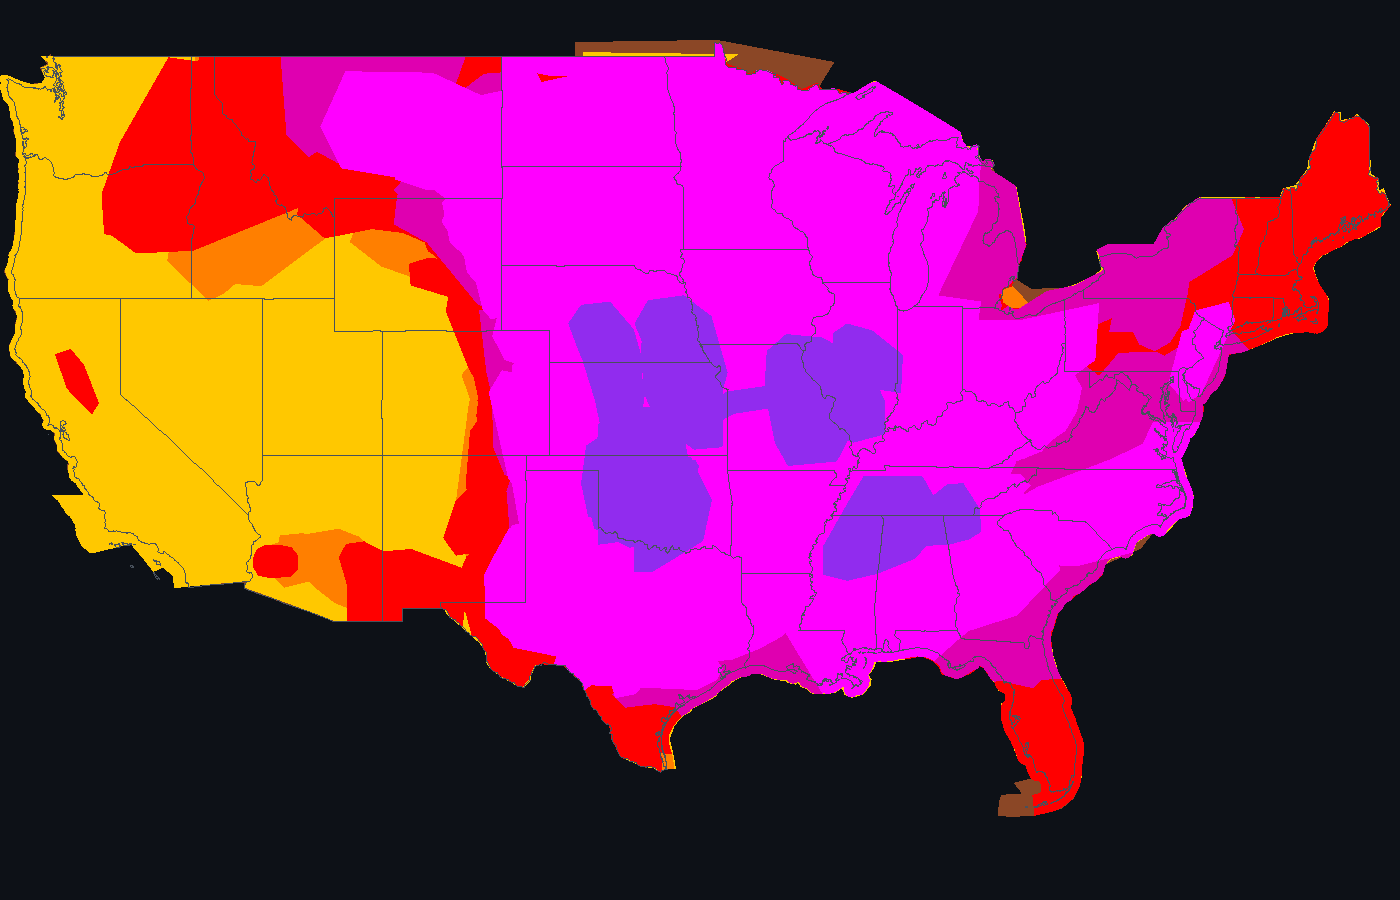
Highest large hail probability ever assigned, 2002 to today.